Expectations for the container shipping market By David Dierker, Ezra Greenberg, Steve Saxon, and Tewodros Tiruneh
Shaping the future
As consumer demand softens and containership effective capacity rebounds, freight rates are expected to normalize. This article explains the outlook for supply, demand, and container industry developments that will shape freight rate developments over the coming years.
Following the surge in North American consumer demand and supply chain congestion issues brought about by Covid-19, shippers saw freight rates rise to six-to-seven times over 2019 averages. Freight rates have begun to fall since January 2022, dropping 30 to 50 percent from their earlier highs (see Exhibit 1). This drop in rates is expected and is occurring a little later than many industry experts (including McKinsey) had predicted. Future expectations should be rooted in an updated understanding of what caused, and sustained, the meteoric rise in rates.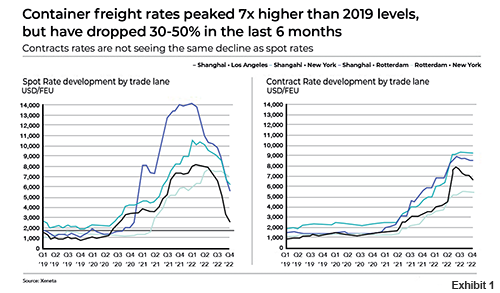
In times of under capacity and high demand, rates rise to levels of the marginal shipper’s willingness to pay
Container freight rates are predominately driven by containerized goods demand, effective containership supply, and carriers’ cost to operate their supply. When demand rises or effective supply is reduced, rates will increase to levels of the marginal shipper’s willingness to pay. This willingness to pay is high for many shippers, as the value of most goods moved in containers is high, and there are limited alternative options for short-term transport. Price rises can therefore be quick and high. This is a well-known behavior to microeconomists and is seen in many commodity industries: they call it a “fly up”.
When effective supply exceeds demand, in a competitive market, rates are determined by the carriers cost to operate their supply – this can effectively be thought of as a rate floor.
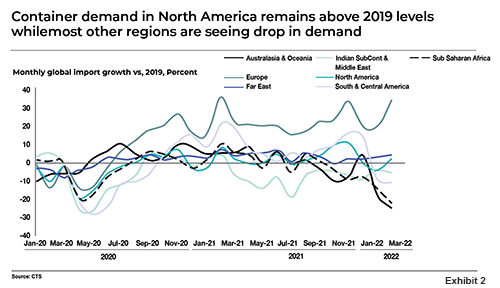
Covid-19 increased containerized goods demand, but globally the increases were only around five percent annual growth. The container industry should have been able to handle five percent growth, through some additional capacity, fuller ships, and faster sailing. The challenge however came from congestion overloading container terminals, inland depots, and warehouses (see Exhibit 2) This congestion was especially acute in North America, which did see a demand spike of 20 to 40 percent above 2019 levels. This additional demand overwhelmed the supply chain, at a time when ports and inland infrastructure was also struggling to get labor to work due to Covid-19 infections. At one point, over 100 ships were waiting for berths off Los Angeles and Long Beach. This led to lengthening of containership transits as a result of port congestion. An estimated 19 percent of effective containership capacity was removed from the system between October 2020 and August 2022 because of congestion. The moderate increased demand and significantly reduced effective supply caused rates to spike, resulting in some freight rates seven times higher than their 2019 average.
 Framing the outlook
Demand for containerized goods is stabilizing. As we write in October 2022, container demand has been lower than 2021 in nine out of the last ten months. Inflationary expectations may dampen future consumer spending, and retailers have built up inventories to levels that they can now take a more conservative approach to ordering. Our demand outlook, based on McKinsey’s most recent macroeconomic economic scenarios and container-trade-to-GDP-multipliers of around one show a demand increase between one to three percent over the next two years.
Effective supply is forecast to increase as ports continue to work through Covid-19 induced congestion, and containership transits are moving closer to their published schedules. Ships ordered during the last two years will deliver an additional 25 percent supply to the market, creating a market with ample supply (see Exhibit 3).
Freight rates are always uncertain; a stable demand and increasing scenario likely has rates 50 percent higher than 2019 levels. In times of ample supply, which has been the case for most of the last two decades of container shipping, price in a competitive market falls to the carriers’ cost to operate their supply.
A fall to 2019 freight rates seemsunlikely, given the carriers’ higher cost bases. Bunker costs are 30 to 90 percenthigher than 2019 levels, depending on if the carriers are using heavy fuel oil with scrubbers or low-sulfur fuels. Ship costs are higher for recently chartered-in vessels. Crew costs are higher from wage inflation as the support of seafarers is tight. A stable rate could therefore be above the 2019 levels. Additionally, the industry is more consolidated, and while still competitive, we can observe carriers taking out capacity through blanking sailings or cancelling some services to closermatch supply to demand, which should stabilize rates.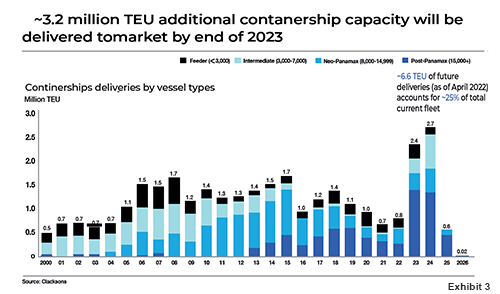
In a scenario where demand remains weak, and congestion continues to improve, we could see rates stabilize at maybe 50 percent higher than 2019 levels. This price level would be a relief to many shippers, and permit carriers to make returns on capital in line with their investors’ expectations.
Port and inland congestion could return: for example, further Covid-19 related closures in China, or industrial action. An alternative scenario has rates remaining at an elevated level – maybe double 2019 levels – due to capacity shortages. There remains a long-term challenge that many regions are not investing sufficiently in the infrastructure needed to support continued growth: North America especially needs more port capacity and inland capacity investments.
A third scenario would have price flying back up to 2021’s levels. For this to occur, we would need to see demand return strongly, and, a major take out of capacity from a major external event, such as alengthy major labor dispute or closure oa key waterway.
Finally, container shipping must decarbonize. The IMO requires a 40 percent reduction in absolute emissions by 2030 from 2008 levels, and a trajectory towards this, marked by the Carbon Intensity Index (CII) starts taking effect in 2023. Some ships may require retrofits to meet these requirements; others will likely sail slower to meet the emissions requirements. This has the effect of taking out effective supply from the market. While we do not see a lack of supply resulting, given the orderbook of 25 percent of the current fleet, it will impact the overall market supply.
Shippers and carriers can reengage on contracts
Historically, shippers and carriers entered into rate agreements that stipulated ocean carriage prices over a duration of time, typically one year. These contracts had clauses for minimum volumes to beprovided by shippers and space guarantees from carriers, but these provisions were rarely enforced.
Recent contracts between shippers and carriers are now stronger having been signed during periods of high rates and low capacity. Many contracts may have take-or-pay or dead-freight clauses that enforce penalties for parties not meeting contractual commitments. Some contracts also include rate adjustment factors tied to shifts in underlying indices for ocean carriage and bunker costs.
The challenge now for shippers and carriers is what to do with these contracts that were signed when rates were 30 to 50 percent higher than today’s spot prices. Some shippers and carriers have reengaged on these contracts, seeking to create win-win scenarios with short-term rate reductions tied to longer-term volume guarantees and improved service levels.With carriers facing a less-constrained market, volume commitments help them maintain supply strategies and make headway against their service level improvement targets
McKinsey
www.mckinsey.com
David Dierker is an expert in McKinsey’s Zurich office, Ezra Greenberg is a partner in the Stamford office, Steve Saxon is a partner in the Shenzhen office, and Tewodros Tiruneh is a C&I expert in the Waltham, Greater Boston office. McKinsey & Company is the trusted advisor and counselor to many of the world’s most influential businesses and institutions.